
If your website is not converting, the fastest path forward is a focused triage, not a redesign. Most low-conversion problems trace back to one of three root causes: the wrong traffic is landing on the page, the value proposition is not clear within five seconds, or a technical friction point (slow load time, broken form, confusing checkout) is killing intent before it becomes action. The good news is that you can identify which one is hurting you right now, before spending a dollar on changes.
Run these three checks in the next 30 to 90 minutes:
- Open GA4 Traffic Acquisition. Filter by channel and compare engagement rates. If organic traffic engages well but paid traffic bounces immediately, you have a targeting problem, not a page problem. Fix the ad before touching the site.
- Run Google PageSpeed Insights on your top landing page. A one-second delay in load time can reduce conversions by roughly 7%. If your Largest Contentful Paint (LCP) is above 2.5 seconds, that is your first fix.
- Show the page to someone who has never seen it. Ask them to describe what you sell and who it is for after five seconds. If they cannot, your above-the-fold copy is the bottleneck. Positioning clarity is one of the most common root causes of low conversions.
These three data points tell you whether to fix targeting, fix the page, or fix the tech. Everything else in this guide builds from that decision.
I am Kahin Warsame, founder of KWA Digital, a web design and business systems studio. I have watched far more websites get fixed by a focused audit and five targeted changes than by a full redesign, and I have seen owners spend thousands rebuilding pages that only needed a clearer headline. This guide is the triage process we run before we agree to build anything for a client.
Is your website not converting because of traffic or the page itself?
Before you change a single headline or button color, you need to answer one question: is traffic the problem, or is the page the problem? Treating a targeting issue like a copy issue wastes weeks.
The diagnostic method that works consistently is a three-step channel comparison. Pull your acquisition report in Google Analytics 4, segment by channel, and look at engagement rate and conversion rate side by side. If one channel converts at 4% and another at 0.3%, the page is not the problem for the first channel. The second channel is sending the wrong visitors.
Next, open Google Search Console and review the queries driving traffic to your top landing pages. If visitors are searching "free project management tool" and landing on a $99/month SaaS page, no amount of CRO will save that page. The intent mismatch is the leak.
Step-by-step CRO audit checklist
Work through these in order. Each step either confirms the problem or rules it out.
| Step | What to check | Tool | Metric to capture |
|---|---|---|---|
| 1. Traffic quality | Engagement rate and conversion rate by channel | GA4 Traffic Acquisition | Engagement rate %, CVR by channel |
| 2. Query intent | Top queries per landing page vs. page offer | Google Search Console | Click-through rate, top 10 queries |
| 3. Page speed | LCP, CLS, FID/INP on top pages | Google PageSpeed Insights | LCP (target: under 2.5s), CLS (under 0.1) |
| 4. Above-the-fold clarity | Five-second test: what, who, why | Real user or UsabilityHub | Pass/fail + qualitative notes |
| 5. Behavior friction | Rage clicks, dead clicks, scroll depth | Hotjar or Microsoft Clarity | Heatmap friction points |
| 6. Form and checkout | Field count, error rate, abandonment | GA4 events + session recordings | Form abandonment %, error triggers |
| 7. Cart abandonment | Drop-off between add-to-cart and purchase | GA4 funnel exploration | Cart abandonment rate % |
Run steps 1-3 yourself in under an hour. Steps 4-7 take another session but produce the data you need to prioritize every fix that follows. Session recordings and heatmaps reveal behavioral friction that analytics tables simply cannot show, including rage clicks on non-clickable elements and scroll depth that exposes where visitors give up reading.
High-impact quick wins you can implement today
Most sites do not need a redesign. They need five specific fixes applied to the right pages. These are the changes that move conversion rates without requiring a developer or a sprint cycle.
- Rewrite your above-the-fold headline as an outcome, not a feature. "Project management software" tells visitors what you sell. "Ship projects on time without the status-update meetings" tells them what they get. That shift alone can lift click-through on your primary CTA.
- Make your primary CTA impossible to miss. It should be visible without scrolling, use a contrasting button color, and carry action-oriented text. "Get started" is weak. "Start your free audit" or "Book a 20-minute demo" is specific and lower-friction. Visible CTAs and simple forms are among the most proven design levers for conversion.
- Add one specific trust signal above the fold. Not a generic "trusted by thousands" badge. A named client logo, a review count with a star rating, or a specific result ("helped 340 small businesses reduce churn by 28%") does the work.
- Compress large images and enable lazy loading. This is a 20-minute fix that can shave seconds off load time with no design changes required.
- Enable guest checkout for e-commerce. Forcing account creation before purchase is one of the most documented conversion killers in retail. Guest checkout removes that wall immediately.
Before/after copy examples
| Feature framing (weak) | Outcome framing (stronger) |
|---|---|
| "Advanced CRM dashboard" | "See every deal's status in one view, updated in real time" |
| "Automated email sequences" | "Follow up with every lead automatically, even while you sleep" |
| "Custom reporting tools" | "Know exactly which campaigns are making you money" |
Pro tip: Prioritize wins that require zero engineering time first. Headline rewrites, CTA text changes, and adding a trust badge can be tested in a single day using your CMS. Save the technical fixes for the second wave.
Technical issues that silently kill conversions
Page speed is not a nice-to-have. A one-second delay in load time is associated with roughly a 7% drop in conversions, and that effect compounds on mobile where network conditions are less predictable. Most small business sites load in 4 to 6 seconds on mobile. That gap between current performance and the 2.5-second LCP threshold is where revenue leaks.
Common fixes and who owns them
| Fix | Typical owner | Effort |
|---|---|---|
| Compress and convert images to WebP | Marketing (CMS plugin or Squoosh) | Low |
| Enable browser caching | Developer or hosting settings | Low |
| Add a CDN (Cloudflare free tier) | Developer or IT | Low-Medium |
| Reduce third-party scripts (chat widgets, tag bloat) | Marketing + Developer | Medium |
| Fix server response time (TTFB) | Hosting upgrade or developer | Medium-High |
| Defer non-critical JavaScript | Developer | Medium |
Pro tip: Fix image weight before anything else. Uncompressed hero images are the single most common cause of slow LCP on small business sites, and fixing them requires no code. Use Squoosh or ShortPixel, then re-run PageSpeed Insights to confirm the gain.
How to set a baseline before you change anything
Changing your site without a documented baseline is like adjusting a recipe without tasting it first. You will not know if the change helped. Before touching a single element, capture these numbers and store them somewhere you will actually reference.
Essential KPIs to document
| KPI | Where to find it | Why it matters |
|---|---|---|
| Sitewide conversion rate | GA4 > Conversions | Your primary health metric |
| Conversion rate by channel | GA4 > Traffic Acquisition | Isolates traffic quality from page quality |
| Engagement rate by landing page | GA4 > Landing Page report | Flags pages with intent mismatch |
| Cart abandonment rate | GA4 Funnel Exploration | Reveals checkout friction |
| Form abandonment rate | GA4 events + Hotjar | Shows where leads drop before submitting |
| Micro-conversions (scroll depth, video plays) | GA4 custom events | Early signals before macro conversions move |
Most sites convert between 2% and 4%, with top performers reaching 5.31% and elite sites exceeding 11%. Knowing where you sit sets a realistic target and tells you how much headroom you have.
GA4 events to implement before testing
Set up these events in GA4 before running any test. Without them, you are measuring shadows.
form_submiton every lead formadd_to_cartandbegin_checkoutfor e-commercepurchasewith revenue value attacheddemo_requestorbooking_confirmedfor service businessesscroll_depthat 25%, 50%, 75%, and 90% thresholds
Store your baseline in a simple spreadsheet: date, traffic volume by channel, conversion rate by channel, LCP score, and the specific event counts above. Tag each row with the traffic source and any active campaigns. When you make a change, add a new row. That timestamped record is your before/after proof. For teams that want a centralized view, a company dashboard that pulls GA4 data in real time removes the manual spreadsheet step entirely.
How to prioritize fixes and run tests that actually teach you something
Not every fix deserves equal attention. The ICE framework (Impact, Confidence, Ease) gives you a fast way to rank your backlog without overthinking it. Score each candidate fix from 1-10 on each dimension, average the scores, and work from the top of the list down.
- List every candidate fix from your audit: headline rewrite, CTA color, form field reduction, image compression, guest checkout, trust badge placement.
- Score each on Impact (how much will this move the conversion rate if it works?), Confidence (how sure are you it will work, based on your data?), and Ease (how fast can you ship it?).
- Average the three scores and rank the list. A headline rewrite that scores 8/7/9 (ICE: 8.0) beats a full page redesign that scores 9/4/2 (ICE: 5.0).
- Write a hypothesis before you test. Format: "If we [change], then [metric] will [increase/decrease] by [amount] because [reason]." This forces clarity and makes results interpretable.
- Test one variable at a time. Changing the headline and the CTA color in the same test means you will never know which change drove the result.
- Calculate your required sample size before you start. Use the Evan Miller sample size calculator to determine how many visitors you need per variant to detect a meaningful difference. At a 2% baseline conversion rate with a 20% minimum detectable effect, you typically need several thousand visitors per variant. If your site does not get that traffic, A/B testing is unreliable and you should focus on qualitative fixes instead.
- Run tests for at least two full business cycles (usually two weeks minimum) to account for day-of-week variation. Stopping early when you see a lift is the most common testing mistake.
Pro tip: If your monthly traffic is under 1,000 sessions, skip A/B testing and use session recordings plus the five-second test to make directional decisions. Underpowered tests produce false confidence, which is worse than no test at all.
CRO is one of the highest-leverage marketing activities available to small businesses in 2026, especially as AI-generated search overviews compress organic click-through rates. Fixing your conversion rate before scaling traffic means every new visitor you pay for is worth more.
When should you redesign vs. keep optimizing?
A redesign is expensive (see what a website redesign costs), time-consuming, and often destroys the testing history you have built. The audit-first approach consistently outperforms the "blow it up and start over" instinct, because incremental changes tell you exactly what moved the needle. That said, there are legitimate triggers for a full redesign.
When a redesign is justified
- Your tracking is clean, you have run multiple tests, and conversion rate has plateaued for three or more months despite meaningful changes.
- The product or offer has fundamentally changed and the site's architecture no longer reflects the customer journey.
- The codebase is so technically degraded that performance fixes require rebuilding components anyway.
- Brand positioning has shifted significantly and the visual identity no longer matches the market you are targeting.
If several of those apply at once, it is worth reviewing the wider signs you need a website redesign before deciding.
When to keep optimizing incrementally
- You have not yet documented a clean baseline or run a single structured test.
- The site is under 18 months old and has not been through a full optimization cycle.
- Traffic volume is too low to validate a redesign's impact with statistical confidence.
- Quick wins (copy, CTA, speed) have not been tested yet.
Rollout best practices if you do redesign
- Use feature-flagged releases so you can roll back individual components without reverting the whole site.
- A/B test your highest-traffic pages post-launch against the old version for at least two weeks before declaring a winner.
- Document your full test history before the redesign goes live. Keep a record of every hypothesis, result, and change. That institutional knowledge disappears in a full rebuild if you do not preserve it deliberately.
- Keep core GA4 tracking events identical across old and new versions so your baseline data remains comparable.
Realistic timelines and cost ranges for every type of fix
Setting the right expectations prevents the most common mistake in CRO: spending $15,000 on a redesign when a $500 copy audit would have moved the number.
Timeline and effort by fix type
| Fix type | Estimated time | Typical cost range | Best owner |
|---|---|---|---|
| Quick wins (copy, CTA, trust badge) | 1-3 days | $0-$500 DIY / $500+ contractor | Marketing or copywriter |
| Performance fixes (images, caching, CDN) | 1-5 days | $0-$500 DIY / $500+ developer | Developer or IT |
| A/B testing cadence (ongoing) | 2-4 weeks per test | $0 (GA4) / $50-$300/mo tool cost | Marketing |
| Full redesign (small business site) | 6+ weeks | $5,000+ agency | Agency or studio |
| CRO audit + implementation (agency) | 2-6 weeks | $2,000+ | CRO specialist or studio |
For realistic small business website cost context, our 2026 cost breakdown covers what you should expect to pay at each tier.
Key takeaways
A website not converting is almost always a diagnosable, fixable problem, and the fastest path to improvement is a structured triage before any redesign decision.
| Point | Details |
|---|---|
| Triage first, always | Open GA4 and PageSpeed Insights before changing anything; identify traffic vs. page problems in under an hour. |
| Baseline before you test | Document conversion rate by channel, LCP score, and key GA4 events so every change is measurable. |
| Quick wins move fast | Copy rewrites, CTA visibility, trust signals, and image compression can lift conversions without a developer. |
| Test with discipline | Use a sample size calculator; test one variable at a time and run tests for at least two full business cycles. |
| KWA Digital's approach | We run an audit-first, demo-first process, identifying the highest-leverage fix before scoping any build or redesign. |
The audit-first approach most sites skip
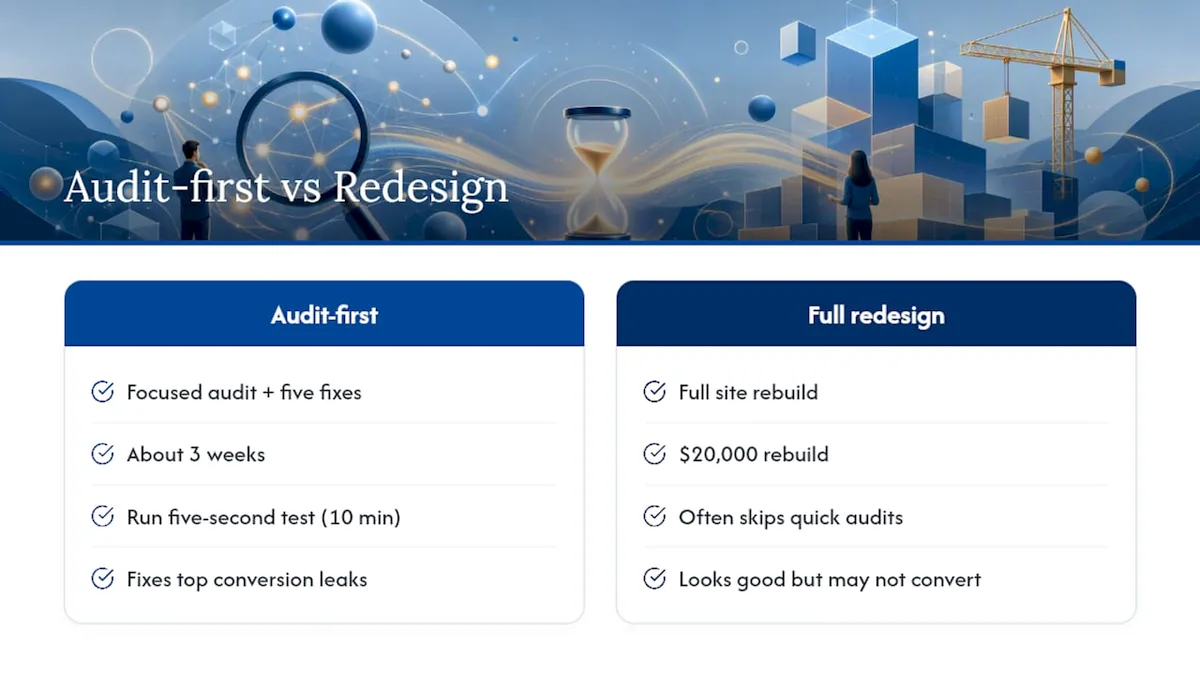
Here is the opinion that most CRO content will not say plainly: the redesign industry has a financial incentive to skip the audit. Agencies get paid more for full rebuilds than for a two-week optimization sprint. That is not a conspiracy, it is just economics. But for most small business sites, a $20,000 redesign is the wrong answer to a problem that a focused audit and five targeted fixes would solve in three weeks.
The five-second test is the most underused diagnostic in the industry. It costs nothing, takes 10 minutes to run, and consistently surfaces the single biggest conversion leak on any page: the visitor does not know what you sell or why they should care. Fix that before you touch anything else. A beautifully designed page with a vague headline still will not convert.
The other thing most guides understate is the compounding value of a documented test history. Every A/B test you run, even a losing one, teaches you something about your audience's psychology. That knowledge does not live in your CMS. It lives in a spreadsheet or a CRO log that most teams never maintain. When you eventually do redesign, that history tells you which elements to preserve and which to challenge. Without it, you are starting from zero every time.
The audit-first, iterate-second model is not just more cost-effective. It builds organizational knowledge that a one-time redesign never can.
KWA Digital fixes conversion leaks before building anything new
If you would rather hand the triage to a team that does this every week, KWA Digital's process starts with an audit snapshot, not a proposal. Before scoping any build, we map your current conversion funnel, identify the highest-leverage bottleneck, and show you a working demo of the fix before a single line of code is committed.
Typical engagements run from audit to first measurable result in two to four weeks for quick-win implementations, and six to twelve weeks for full custom builds that include CRM pipelines, marketing automation workflows, and post-conversion follow-up systems. Every engagement includes a measurement plan with documented baseline KPIs and defined success metrics, so you know exactly what improved and by how much.
Pricing is scoped transparently after the audit, not before. You can review past work and the range of systems built in our portfolio, see our dedicated website design and redesign service, or go directly to the services page to see what a typical engagement covers. If you are ready to find out where your site is leaking revenue, book a demo and get an audit snapshot within the first session.
Authoritative tools and sources for your audit
| Tool | What to use it for | Link |
|---|---|---|
| Google Analytics 4 | Baseline conversion rate, channel segmentation, funnel exploration | analytics.google.com |
| Google Search Console | Query intent review, landing page CTR, indexing issues | search.google.com/search-console |
| Google PageSpeed Insights | LCP, CLS, INP scores and fix recommendations | pagespeed.web.dev |
| Hotjar | Session recordings, heatmaps, form analytics | hotjar.com |
| Microsoft Clarity | Free session recordings and heatmaps | clarity.microsoft.com |
| Evan Miller sample size calculator | Determine required traffic before starting any A/B test | evanmiller.org |
For deeper reading on testing methodology and conversion topics specific to small business and e-commerce contexts, visit our blog. The HubSpot CRO guide linked above remains one of the most thorough publicly available references for conversion rate optimization strategy.
Find the leak before you pay for a redesign.
Tell us what your site is supposed to do, and we will run the triage: where visitors drop off, what is costing you conversions, and the highest-leverage fix, shown as a working demo.
Request a free audit snapshot